

FCC Allocation Chart
📊 How to Use the FCC Frequency Allocation Chart to Identify Signals
“Every signal has a home — and if it doesn’t, it’s either broken… or classified.”
The FCC Frequency Allocation Chart is like a map of the RF universe. Every legal, regulated signal in the U.S. — from cell towers to military radar — is assigned a specific frequency range. Learning to read this chart can help you:
- ✅ Identify what a signal should be
- ⚠️ Detect illegal or covert transmissions
- 🔍 Narrow down what’s really targeting you
🗺 What Is the FCC Allocation Chart?
The FCC (Federal Communications Commission) created this master chart to show how all usable frequencies from 9 kHz to 300 GHz are divided up for:
- Civilian use
- Government systems
- Scientific research
- Commercial industries
- Military applications
📐 Key Parts of the Chart
| Element | Meaning |
|---|---|
| 📦 Band Blocks | Horizontal bars represent frequency ranges (e.g. 902–928 MHz) |
| 🎨 Color Coding | Each color represents a type of service (e.g. Fixed, Mobile, Radar, SatCom) |
| 🔠 Labels | Show what type of system is allowed there — e.g. AMATEUR, ISM, GOVERNMENT |
| 📏 Scale | Frequencies increase left to right, from kHz to GHz (logarithmic spacing) |
📌 Tip: Use Ctrl+F in the PDF to search for specific bands or keywords like “UWB”, “ISM”, or “radar”.
🔍 Why It’s Useful for TIs & RF Investigators
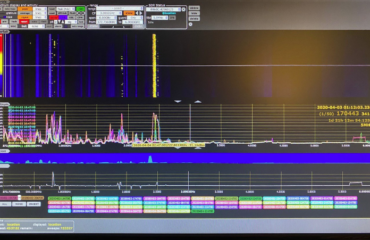
If you detect a signal on your spectrum analyzer at 1.33 GHz, for example:
- Check the allocation chart for the range: 1300–1350 MHz
- See if it’s listed as: Radiolocation (GOV) or Aeronautical Radionavigation
- If it’s not listed at all, or overlaps multiple zones, it might be:
- A spread spectrum system
- A covert military test band
- An illegal transmission or unlicensed device
This is how professionals spot suspicious activity.
🧪 Example: Tracking Down a Signal
You see a sharp narrowband spike at 2.45 GHz.
- Look it up on the chart:
- 2400–2500 MHz = ISM band
- Used for: Wi-Fi, Bluetooth, microwave ovens, some medical devices
- If the waveform is not Wi-Fi shaped, not modulated, and never drops, it could be:
- A beacon or surveillance signal riding the ISM band to hide
- A deliberate carrier masking technique
- Knowing the allocation gives you a starting point for deeper analysis.
🛠 Tools to Combine With the Chart
| Tool | Purpose |
|---|---|
| 🖥 SDR + Waterfall | Scan and visualize real-time signals |
| 📐 BB60C | High-resolution spectrum snapshots |
| 📁 FCC ULS Database | Match licensed emitters to signal zones |
| 📊 Signal classifiers | Label common signals using known shapes (e.g. LTE, Wi-Fi, etc.) |
🧬 Real-World Use for Targeted Individuals
- 🕵️ Log every suspicious frequency with time, location, and amplitude
- 🧭 Use the chart to see if the signal belongs — or is out-of-place
- 📎 Build reports and overlays to track what’s hitting you and when
- 🧱 Create targeted shielding by knowing exact frequency zones
- 📡 Match detected signals to FCC licenses — or expose unlicensed emitters
🔓 Final Thought
The FCC Allocation Chart isn’t just for engineers — it’s a truth map. If you’re being hit with unknown signals, this chart helps you separate the authorized from the anomalous.
🛡 Know the bands. Know the laws. Find the ghosts.
Pro Tip download it and Zoom in!