


Basic Guide to Detecting State Actors with TSCM Equipment
Guide to Detecting State Actors with TSCM Equipment
Note: This Guide is the basics of what skills are needed to find a state actor using a spectrum analyzer only. It does not go over other TSCM equipment that are used to find bugs in a localized environment. There are many other tools a TSCM is trained on that are out of scope for this tutorial and are not needed for this type of threat of finding long range surveillance equipment affecting a individual.
Overview: Detecting state actors with Technical Surveillance Countermeasures (TSCM) equipment requires specialized tools and knowledge. These actors often transmit narrowband signals that operate below the noise floor, making them hard to detect. This guide outlines the necessary methods, equipment, and software for conducting high-resolution sweeps and interpreting data effectively, including how time-based or location-based differentials can expose hidden signals.
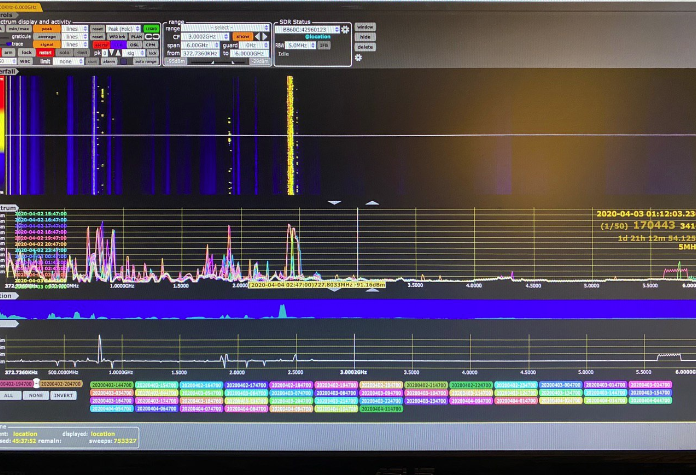
1. Time-Based and Location-Based Differentials
- Time-Based Differential: This method visualizes changes in frequency activity over a set time span. For example, each 15-minute interval of a sweep is represented by a different color. By analyzing the frequency activity during these set time intervals, you can detect signals that might only appear intermittently or that change behavior over time. This helps expose signals from state actors who may operate sporadically to avoid detection. You can manually adjust the time window to optimize detection based on the environment or threat level.
- Location-Based Differential: In contrast, a location-based differential compares data collected from different physical locations. Each sweep conducted at a different location is represented by a different color. By comparing the frequency activity between these locations, you can filter out environmental noise that might be consistent across locations and pinpoint signals that are only present in a specific area. This technique is particularly useful when tracking localized transmissions, such as bugs or covert transmitters hidden in buildings.
Note: I recommend writing your own version of the differential in python for a bb60c Because software for TSCM is controlled goods and you have to have training to acquire it.
2. Hiding Below the Noise Floor
- State Actors and Narrowband Signals: State actors often use narrowband transmissions designed to hide under the noise floor, making detection by conventional equipment challenging. These signals blend into the surrounding electromagnetic environment and are difficult to distinguish from natural noise. Since state actor transmissions often have a low signal strength, equipment with high sensitivity is required to detect them.
- Noise Floor Measurement: The theoretical noise floor in an ideal environment is -174 dBm. However, practical limitations and environmental factors can raise this value. For typical TSCM operations, a noise floor close to -172 dBm is necessary for effective detection. If your equipment cannot detect signals below this threshold, there is a high risk of missing transmissions from state actors. Using the appropriate narrowband receiver bandwidth (RBW) and signal processing techniques can help reduce the effective noise floor and enhance sensitivity.
- Thermal Noise and Bandwidth (kTB): The primary contributor to the noise floor is thermal noise, which can be calculated using Boltzmann’s constant and bandwidth. As the RBW narrows, the noise floor decreases, allowing the equipment to detect weaker signals. In the context of TSCM, reducing the noise floor is critical for identifying signals that operate near the thermal noise level.
- Impact of Bandwidth: The table below shows the relationship between bandwidth and the corresponding noise floor in dBm. As bandwidth decreases, the noise floor drops, improving the ability to detect low-level signals: |Resolution Bandwidth (Hz)|Noise Floor (dBm)|
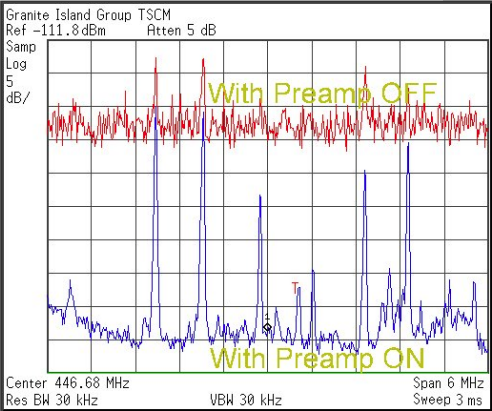
- Reducing the Noise Floor: In a practical TSCM setup, you can further reduce the noise floor using preamplifiers, pre-selectors, and high-gain directional antennas. These measures improve the detection of weak transmissions hidden beneath thermal noise. Additionally, advanced signal processing techniques like statistical averaging can enhance sensitivity by 15-20 dB, revealing signals that would otherwise remain undetected(www-tscm-com-TSCM101noi…).
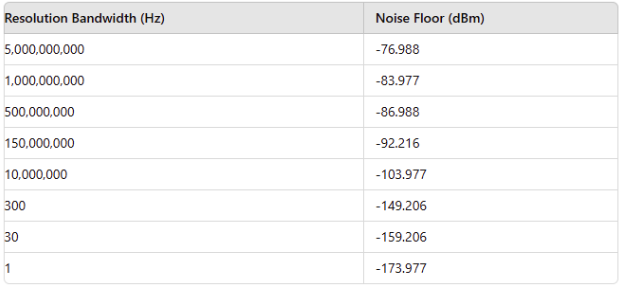
By achieving a sufficiently low noise floor (ideally close to -174 dBm), TSCM specialists can detect even the faintest signals, ensuring that no critical transmission from a state actor goes unnoticed. No signal can hide from you if your equipment is in the right range and right resolution and area of the noise floor where its hiding.
3. Equipment Requirements
- Spectrum Analyzer (BB60C): The BB60C or similar high-resolution spectrum analyzers are necessary to detect signals from state actors. The BB60C can sweep across a wide frequency range (up to 6 GHz or more) and at a resolution of 300 Hz or finer. This level of precision is required to detect narrowband transmissions that may be hiding below the noise floor.
- Antenna Selection: For accurate detection, use a directional antenna with a beamwidth around 14 degrees. This helps focus on signals in a confined space, which is essential when trying to pinpoint a bug or narrowband transmission. Wide-beam antennas are less effective for locating the exact source, as they capture too many irrelevant signals from distant sources.
4. Signal Intelligence Software and Frequency Classification
- Waterfall and FFT Plots: These visual tools are critical in identifying hidden transmissions. Waterfall plots show frequency activity over time, while FFT plots display real-time frequency and amplitude. Hidden signals often manifest as thin, consistent lines or narrow spikes. These tools help track subtle changes or irregularities that state actors exploit to hide their transmissions.
- Thermal Effects and Harmonics: On a spectrum analyzer, thermal noise appears as gradual fluctuations across the noise floor. State actor transmissions, however, will appear as spikes or subtle changes just above the thermal noise. Using a harmonics calculator helps determine whether a detected signal is a true base signal (the fundamental frequency) or a harmonic distortion from another source.
5. Super High-Resolution Sweeps
- 300 Hz Resolution for State Actors: To detect signals from state actors, it’s crucial to sweep at 300 Hz or finer resolution. This captures narrowband signals that may be hidden below the noise floor, helping to expose transmissions that are designed to be stealthy.
- 20 kHz Resolution for Bugs: For lower-level threats like bugs, use a broader sweep resolution of 20 kHz, which is sufficient to detect common consumer-grade surveillance devices.
- 15-Minute Sweep Intervals: Conduct sweeps for 15 minutes in each location to collect sufficient data. Then move to other areas (either within a building or across different regions) to compare signals and identify which ones are stationary and which ones are location-specific.
6. Building a Shielded Room
- Shielded Room Attenuation: A minimum of 70 dB attenuation is recommended for building a shielded room that blocks external RF noise. However, 140 dB of attenuation is ideal for maximum isolation, especially when trying to detect faint transmissions that could be attacking a person or covertly operating within the room.
- Purpose of the Shielded Room: If a signal persists in a shielded environment, it strongly indicates a localized source (such as a bug or transmitter) or a direct attack on the person inside. Shielded rooms allow you to isolate the signal from outside noise, making it easier to determine if the threat is internal.
7. Challenges with Common Analyzers
- 95% of Analyzers Can’t Detect State Actor Signals: Most off-the-shelf spectrum analyzers are incapable of detecting narrowband signals from state actors due to limitations in dynamic range and sensitivity. Without the ability to detect signals below -172 dBm, it’s impossible to see everything, meaning critical transmissions could be missed. Only specialized equipment like the BB60C or high-end TSCM tools are capable of capturing these faint signals.
8. Understanding Differentials and Image Analysis
- Clicking on Color Codes: In the differential image you provided, each color represents a specific sweep. By clicking on the color tabs, you can see the frequency activity for the associated time or location. This is a powerful tool for identifying time-based anomalies or location-specific transmissions.
- Location-Based Visualization: For location-based sweeps, each color represents a different physical location. This method helps identify signals that are only present in certain areas, enabling you to pinpoint localized threats such as bugs or hidden transmitters.
9. Adding Anomalies to the Signal of Interest (SOI) List
- Confirming the Anomaly: Once you find an anomaly in the differential (whether time-based or location-based), verify it by checking for its consistency across multiple sweeps. If the signal persists over time or location, it is likely an active transmission.
- Identifying the Fundamental Frequency: The signal causing the threat is referred to as the fundamental frequency.
- Classify the Signal: Once confirmed, the signal can be classified using tools like Signal Identification Wiki to determine its origin and characteristics. This classification will help determine whether it is an intentional transmission, a bug, or part of a broader surveillance network.
- Add to SOI List: Once the signal has been confirmed and classified, it should be added to the Signal of Interest (SOI) list. This list will help track all suspicious transmissions, recording their frequency, location, and time of detection. You can also include notes on behavior, such as frequency hopping or burst patterns, for future analysis.