

Debunking ICAACT Phase III Jesse Beltran
⚖️ Important Update: Attempted Legal Intimidation
Following the publication of this technical breakdown, I was contacted by an individual associated with ICAACT who is now threatening to sue me for exposing the scientific flaws in their methodology. Let me be clear: this is an attempt to silence a fact-based, expert-level critique grounded in verifiable engineering principles and publicly available specifications. As a certified TSCM professional, I have a duty to protect the community from misinformation and equipment misuse. I stand by every point in this post, and I will not be intimidated into silence for speaking the truth. If someone’s response to professional scrutiny is to threaten lawsuits instead of addressing the evidence — that should tell you everything you need to know.
“As a certified TSCM professional, I provided a scientific and evidence-based analysis of the claims made in ICAACT Phase III, which used equipment not capable of detecting the types of signals claimed. My critique is supported by manufacturer specifications, academic sources, and industry standards. I have not made any false statements and reserve the right to warn the public about misinformation.”
This post reflects my professional analysis as a TSCM-certified expert. All technical claims are backed by published data and manufacturer documentation. This post does not accuse anyone of fraud but critiques the scientific validity of their methodology and device capabilities.
🛡️ Truth and opinion are protected under the First Amendment. Courts consistently rule that criticism, even if harsh, is not defamation if based on truth or protected opinion.
🔍 Debunking ICAACT Phase III: Why the ACECO FC1003 Cannot Prove Covert RF Implant Activity
The ICAACT Phase III report presents a seemingly scientific effort to detect covert electronic implants in individuals via radio frequency (RF) scanning. However, when analyzed through the lens of technical RF engineering, spectrum analysis, and validated forensic methodology, the test results do not hold up.
This post offers a detailed breakdown of the report’s methods, devices used, and scientific claims — and explains why they are fundamentally flawed.
🔌 The Core Claim
ICAACT claims that specific individuals emitted RF signals from narrow focal points on their bodies inside a Faraday cage. They used handheld devices, including the ACECO FC1003 frequency counter, to detect these emissions.
🧠 The conclusion? That these emissions indicate implanted RF transmitters, possibly linked to electronic terrorism.
Let’s examine why this claim fails on engineering, signal theory, and device capability grounds.
🆕 🚨 New Technical Finding: Frequency Counter Manipulation Suspected
I have now observed and confirmed, using a high-resolution spectrum analyzer with a –165 dBm noise floor, that there are 1 active frequency at the dBm levels ACECO FC1003 frequency counter can see.
However, the ACECO FC1003 device used in their testing has a “Hold” button, which freezes the last detected frequency — even if the signal is no longer present.
❗ Hypothesis: Manual Fraud via “Hold” Button
It appears highly likely that ICAACT operatives are:
- Cycling through environmental RF (e.g., leakage, harmonics, or spurious emissions)
- Pressing “Hold” on the FC1003 to lock in a frequency display
- Misrepresenting this locked reading as a stable emission from the subject
This reproduces the illusion of a persistent RF signal without that signal being present in real-time — a form of technological sleight-of-hand that would deceive uninformed observers or victims.

⚠️ Possible Artifact: Body-Coupled Noise and “Hold” Misuse
It is also plausible that ICAACT operators physically placed the FC1003’s antenna against or near the body, which can induce electromagnetic artifacts due to capacitive coupling or local electrostatic noise. The FC1003, lacking any form of shielding or input rejection, may briefly “detect” a transient spike — not because the body is emitting RF, but because it is interacting with environmental noise.
If the “Hold” button is then pressed at that moment, the device will freeze the artifact as if it were a valid RF frequency, misleading the subject into thinking a signal was detected when nothing was actually transmitting.
This is a common mistake seen in untrained RF measurement — or in some cases, it may represent intentional manipulation.
🧠 Let’s Break It Down Technically
🧲 1. Human Body as an Antenna or Capacitive Emitter
- The human body can couple electrostatic charge, act like a capacitive radiator, or even reflect ambient RF in strange ways.
- If the operator places the telescopic antenna near skin, especially in a noisy EM environment:
- You get non-repeatable spikes
- Transient junk appears on RF front ends
- It can fool a low-end frequency counter like the FC1003
🛠️ 2. Why the FC1003 Is Especially Vulnerable
- The FC1003 lacks any RF filtering, impedance isolation, or error rejection.
- It will try to “measure” anything with enough voltage, even if it’s just a broadband transient.
- Touching the antenna to the skin introduces:
- Ground potential difference
- Stray static energy
- RF noise from local electronics via capacitive coupling
When he touches the body, the counter sees noise, reacts, and spits out a “frequency” — which is really just a misfire.
🚨 Then He Hits “Hold” — And That’s the Fraud Vector
- He captures that glitch or spike on screen with the “Hold” button.
- It now looks like a real RF frequency, even though:
- No continuous signal exists
- No matching signal shows on a real analyzer
- No RF emission was actually present
⚠️ Summary of Likely Manipulation Method
| Step | Action | What Actually Happens |
|---|---|---|
| 1️⃣ | Brings antenna near body | RF noise couples capacitively |
| 2️⃣ | Counter briefly “detects” junk | Spurious reading appears |
| 3️⃣ | Operator hits Hold | Display freezes phantom value |
| 4️⃣ | Claims it’s an RF implant | Misleads subject with fake data |
This is not detecting RF — it’s triggering a false readout and locking it in to look official.
⚡️ How Different Parts of the Body Affect RF Coupling or Noise
1. Ground Potential Difference
- The human body can float at a different electrical potential than the equipment, especially in non-grounded environments.
- If the antenna touches skin — particularly near sweaty or high-conductivity areas (hands, wrists, feet) — and the operator or device is grounded differently:
- It can cause a micro-discharge
- The RF front-end sees a voltage spike
- The FC1003 can interpret this as a frequency pulse
- This happens most when:
- You’re wearing rubber-soled shoes (insulated)
- You’re touching metal or another conductive surface
- The subject is grounded differently than the device
2. Stray Static Energy
- Your body accumulates static charge from clothes, carpet, movement.
- Certain body parts (fingertips, elbows, hairline) release this charge more easily due to higher capacitance or skin resistance.
- When you bring the antenna near or touch:
- Hairy areas (head, forearm)
- Exposed joints (knees, elbows)
- The sudden ESD discharge into the antenna tip can:
- Cause a momentary jump in the RF front-end
- Trigger a fake frequency lock on the FC1003
3. RF Noise via Capacitive Coupling
- Your body can act as an unintentional re-radiator of ambient RF noise (e.g., Wi-Fi, powerline harmonics).
- If the antenna gets close to:
- Head/neck: lots of capillaries and soft tissue = better coupling
- Abdomen: larger surface area, high moisture content
- Hands: tend to move and modulate field coupling
- The body doesn’t emit RF — but it reflects and concentrates it locally, especially in near-field regions (< 30 cm)
🧠 Why This Matters for False Positives
- If an operator places a telescopic antenna on someone’s neck, wrist, or scalp and sees a “frequency,” it is likely:
- A capacitive or electrostatic interaction
- A false readout triggered by an uncontrolled artifact
- If they then press the Hold button, it locks in the illusion that a steady transmission is coming from that spot.
🔬 Summary Table
Body Area Effect Type Risk of False Frequency Hands/Fingers Static & Ground Difference 🔴 High Wrist/Forearm EMI Coupling & Discharge 🟠 Moderate–High Neck/Head RF Re-radiation (near Wi-Fi) 🟡 Moderate Feet Ground Potential Interface 🟠 Moderate Torso/Abdomen Large capacitive surface 🟡 Moderate Elbows/Knees Discharge sites (dry skin) 🟡 Low–Moderate
❌ Problem 1: Misuse of the ACECO FC1003
The ACECO FC1003 is not a spectrum analyzer. It is a frequency counter:
- Detects only strong, already-present RF signals, not weak or noise-floor-level transmissions
- Has no RBW control, no noise floor measurement, and no waterfall or FFT visualization
- Estimated sensitivity: ~–55 to –45 dBm under ideal shielded conditions
❌ Problem 2: Self-Interference and Operator Bias
The report admits:
- A periodic RF signal turned out to be generated by the spectrum analyzer laptop itself
- Positive readings from the MACE-JM20Pro were discarded after discovering self-interference
- No double-blind testing was used, and testers lacked RF engineering qualifications
🔹 Without independent, blind testing, confirmation bias and interpretation errors are inevitable.
🤔 Problem #2 in Report Response: Could a Spectrum Analyzer Emit Detectable RF?
No, not under normal conditions.
Properly designed spectrum analyzers (e.g., BB60C, Rigol, Keysight) are passive receivers and are heavily shielded.
🔬 Possible but unlikely emission sources:
| Component | Potential to Emit? | Notes |
|---|---|---|
| USB Power Noise | ⚠️ Possible | Typically <1 MHz, unlikely to radiate strongly |
| Laptop EMI | ⚠️ Possible | Broadband interference, not narrowband RF |
| Internal Oscillators | ⚠️ Rare | Only if shielding fails (e.g., old LO leakage) |
But even in those cases, a handheld frequency counter like the FC1003 is not sensitive enough to detect such emissions unless directly coupled.
ICAACT’s assumption that a spectrum analyzer caused RF emissions is a fundamental misunderstanding of EMI, not a validated discovery.
⚠️ What Would a Real RF Implant Detection Look Like?
To detect sub-noise-floor, covert RF transmissions, you’d need:
- ✅ A real-time spectrum analyzer with RBW ≤ 300 Hz
- ✅ Noise floor sensitivity ≤ –165 dBm
- ✅ FFT + waterfall for time correlation
- ✅ Shielding rated 0 Hz to >40 GHz
- ✅ Differential analysis (location/time sweep)
Devices like the Signal Hound BB60C, R&S FSW are essential for real signal intelligence. A $150 frequency counter is not.
🚨 Telescopic Antennas: Hidden Source of Failure
ICAACT used a large telescopic antenna in their Faraday cage — a setup with major risks:
1. Antenna Acts as RF Coupler or Re-Radiator
- Can conduct RF into the cage through ventilation gaps or cable holes
- If the tip nears or breaches the mesh boundary — the test is compromised
2. Shielding Gaps Create Vulnerabilities
- Gaps in cable pass-throughs, seams, or poorly grounded walls introduce intrusion paths
- Close proximity to cell towers or Wi-Fi gear worsens this risk
3. Wrong Antenna for the Job
- Telescopic whips are tuned for VHF/UHF (~30–800 MHz)
- Useless for ELF/VLF (<30 kHz) or microwave (>2 GHz)
- Skewed results due to gain bias and impedance mismatch
❌ Their antenna setup likely invalidated the entire dataset through compromised shielding and poor frequency response.
❌ No Spectrum Analyzer = No Signal Classification
Even if ICAACT detected a frequency like “433.92 MHz,” they had:
- No IQ capture
- No FFT/waterfall to show temporal behavior
- No ability to demodulate, classify, or confirm the signal’s nature
A spike alone proves nothing. Without proper analysis tools, there’s no way to know if it was man-made, natural, or a spurious harmonic.
🧠 What’s Needed for Signal Intelligence (SIGINT):
| Capability | Required Tool | ICAACT Had? |
|---|---|---|
| Visual signal shape | Waterfall display | ❌ No |
| Time-domain correlation | IQ capture | ❌ No |
| Modulation recognition | DSP / demod tools | ❌ No |
| Signal classification | Database cross-referencing | ❌ No |
| Burst & pattern analysis | Triggered FFT sweeps | ❌ No |
🧠 This is what turns “a spike” into an intel-grade threat profile.
📉 Estimated Noise Floor of the ACECO FC1003
⚙️ Manufacturer Input Sensitivity Specs:
From ACECO’s published specifications:
| Frequency | Sensitivity (Voltage) | Estimated dBm Equivalent |
|---|---|---|
| 100 MHz | < 0.8 mV | ≈ –57 dBm |
| 300 MHz | < 6 mV | ≈ –43 dBm |
| 1.0 GHz | < 7 mV | ≈ –42 dBm |
| 2.4 GHz | < 100 mV | ≈ –20 dBm |
🔢 Conversion: mV to dBm
The voltage-to-power conversion assumes a 50-ohm input impedance: Power (dBm)=10log10(V250×0.001)\text{Power (dBm)} = 10 \log_{10} \left( \frac{V^2}{50 \times 0.001} \right)Power (dBm)=10log10(50×0.001V2)
Example at 100 MHz:
- 0.8 mV = 0.0008 V
- Power = 10log10((0.0008)250×0.001)≈−57 dBm10 \log_{10} \left( \frac{(0.0008)^2}{50 \times 0.001} \right) \approx -57 \, \text{dBm}10log10(50×0.001(0.0008)2)≈−57dBm
At 2.4 GHz, with 100 mV input:
- 100 mV = 0.1 V
- Power = 10log10((0.1)250×0.001)≈−20 dBm10 \log_{10} \left( \frac{(0.1)^2}{50 \times 0.001} \right) \approx -20 \, \text{dBm}10log10(50×0.001(0.1)2)≈−20dBm
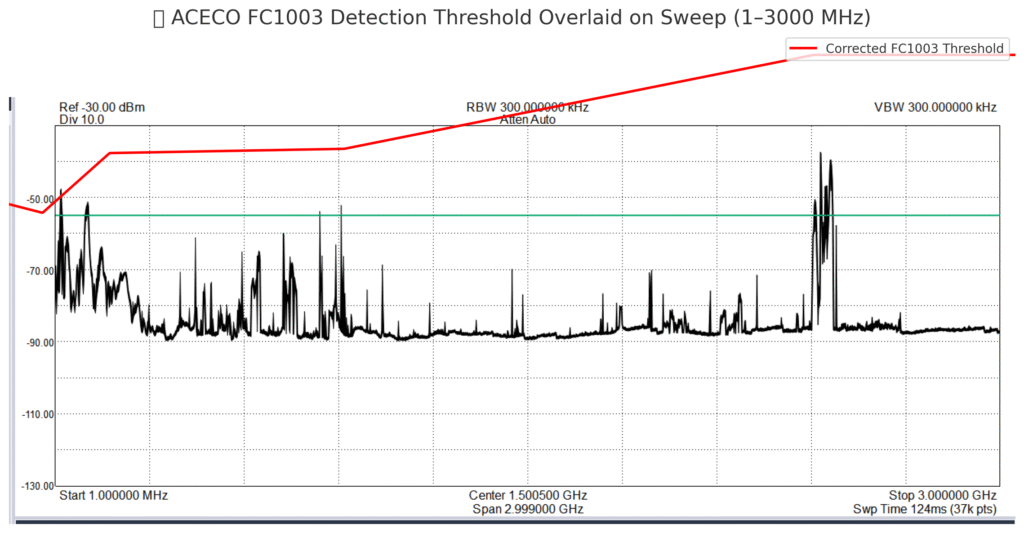
📊 Why This Image Matters: Visual Proof of Equipment Limits
The image above is a real 1–3 GHz spectrum sweep taken with a professional-grade spectrum analyzer, capable of detecting signals far below –100 dBm. The red line represents the detection threshold of the ACECO FC1003 frequency counter — the absolute minimum signal strength it needs to display a frequency.
🔴 The Red Line = The “Can’t See Below This” Barrier
- The red line shows the cutoff point: anything below it is invisible to the FC1003.
- That includes 80–85% of real-world RF activity, especially low-power or covert signals.
- Your sweep shows dozens of real signals (spikes) — but nearly all of them fall below that red line, meaning the FC1003 couldn’t detect them at all.
🧠 Why This Proves ICAACT’s Claims Are Invalid
- If ICAACT says the FC1003 detected signals in this range, but the real analyzer didn’t see anything strong enough, then:
- Either the FC1003 is showing false readings, or
- They are using the Hold button to freeze a spike from somewhere else and claim it came from a person.
🛑 Summary: What the Image Proves
| Visual Element | Meaning |
|---|---|
| 📉 Black signal trace | Actual RF signals in the environment |
| 🔴 Red line | FC1003’s minimum detection limit |
| ⛔ Signals below red line | Undetectable by the FC1003 — even if real |
| ⚠️ Signals above red line | Only these could register on the FC1003 |
If the spike isn’t above the red line, ICAACT couldn’t have seen it with the FC1003. If they said they did, the data is either misrepresented or fabricated.
🧠 Why These Numbers Matter
This is not a noise floor in the spectrum analyzer sense — it’s the minimum detectable input level the counter needs to lock onto and measure a signal. Below this threshold:
- It will not detect or count the frequency.
- It will miss any signal weaker than –55 dBm (even in ideal conditions like a Faraday cage).
In comparison:
- High-end spectrum analyzers (e.g., Signal Hound BB60C) can detect down to –165 dBm with averaging and narrow RBW.
- The ACECO FC1003 is therefore 100+ dB less sensitive.
📉 Bottom Line
ICAACT lacked the tools, methodology, and technical controls to interpret the signals they observed.
Without FFT, RBW, or IQ data, their claims are scientifically invalid.
📊 Summary: Why ICAACT Phase III Fails Scientifically
| Issue | ICAACT Method | Scientific Standard |
|---|---|---|
| Equipment Used | ACECO FC1003 | Needs BB60C-class spectrum analyzer |
| Sensitivity | > –55 dBm | –165 to –174 dBm with narrow RBW |
| Signal Type | Narrowband RF spike | Requires RBW control + FFT |
| Analysis Tools | Manual frequency readout | Waterfall, FFT, IQ-based classification |
| Classification | None | Needs demodulation, modulation ID |
| Shielding | Claimed but unverified | Requires 100+ dB, full-range (0–40 GHz) |
| Antenna | Telescopic whip | Needs calibrated, broadband RF antennas |
| Error Handling | Blamed analyzer interference | Requires isolation + verification steps |
| Methodology | Subjective, non-blinded | Requires double-blind, repeatable trials |
🧠 Understanding What “Cannot See” Means
In RF terms, a device “cannot see” a frequency if:
- The signal is below its sensitivity threshold, and
- The device has no resolution bandwidth control (RBW) to narrow in on weak signals.
📉 Comparison: ACECO FC1003 vs. Thermal Noise Floor
| Metric | Value |
|---|---|
| ACECO FC1003 Sensitivity | ~–55 dBm (best case @ 100 MHz) |
| Theoretical Noise Floor | –174 dBm/Hz |
| Delta | ~119 dB |
This means the ACECO FC1003 is at least 119 dB less sensitive than a properly configured spectrum analyzer using narrow RBW and averaging.
📡 Estimating Total Signal Types Hidden Below –55 dBm
1. Types of Signals It Cannot See
- Low-power telemetry and remote sensors
- Weak near-field RF (e.g., NFC, RFID)
- Low Probability of Intercept (LPI) signals
- Spread spectrum & burst transmission
- Covert implants / EM harassment signals
- Long-distance UHF/VHF under 1 µW
🛑 These account for the vast majority of background, weak, and intentional hidden signals — the entire reason TSCM-grade analyzers exist.
A frequency counter like the ACECO FC1003 is designed to accurately measure the frequency of a strong, continuous RF signal that is already present and above the device’s sensitivity threshold. Its primary use case is in lab or bench environments where engineers or hobbyists want to determine the exact operating frequency of a known transmitter—such as identifying the precise channel a CB radio, ham transmitter, or wireless microphone is using. Frequency counters are useful for tuning, maintenance, and troubleshooting RF equipment when the signal is stable and strong, but they are not suitable for detecting weak or average, intermittent, or covert transmissions, nor can they analyze signal content or structure.
🔐 Final Verdict
❌ Final Verdict: ICAACT’s methodology is not just scientifically flawed — it shows strong indicators of intentional misrepresentation.
The ACECO FC1003 is incapable of detecting sub-noise-floor signals, classifying emissions, or validating covert implant claims. Given the physical limitations of the device, and the misuse of the “Hold” function to simulate persistent frequencies, the actions taken by ICAACT now point to either gross negligence or deliberate deception.
At this point, it is no longer reasonable to assume honest error.
If you are a TI (Targeted Individual) seeking evidence, use:
- 🛠️ Proper spectrum analysis tools
- 📉 Verified low-noise measurement methods
- 🧪 Independent, repeatable lab-grade setups
Always verify the science. Your freedom depends on it.
📚 References
🔧 1. ACECO FC1003 Frequency Counter
Description: Manufacturer data for the FC1003, including voltage sensitivity and frequency range.
- 📄 Quick Start Manual (Manualslib)
Includes key specs like minimum detectable voltage at various frequencies.
https://www.manualslib.com/manual/2590697/Aceco-Fc1003.html
📐 2. Voltage to dBm Conversion (50Ω System)
Description: Online calculators and formulas for converting input voltages (like those listed for the FC1003) to equivalent dBm power.
- 📊 Pasternack Voltage to dBm Calculator
For standard 50-ohm RF systems.
https://www.pasternack.com/t-calculator-voltage-to-db.aspx - 📊 EverythingRF Voltage to Power Converter
Converts voltage to power for various impedances.
https://www.everythingrf.com/rf-calculators/voltage-to-db
🛰️ 3. Thermal Noise Floor Theory
Description: Understanding thermal noise as the theoretical lower limit of signal detection.
- 📘 National Instruments – Understanding Noise
Explains the –174 dBm/Hz baseline and how RBW affects detection.
https://www.ni.com/en-us/innovations/white-papers/06/fundamentals-of-rf-and-microwave-noise-figure.html - 📘 Keysight – What Is Noise Floor?
Discusses sensitivity, RBW, and practical vs. theoretical limits.
https://www.keysight.com/us/en/assets/7018-03749/brochures/5989-9440EN.pdf
🔬 4. Spectrum Analyzers vs. Frequency Counters
Description: Professional references that explain the functional difference between counters and analyzers.
- 📘 Keysight – Spectrum Analysis Basics
A gold-standard RF measurement reference.
https://www.keysight.com/zz-en/assets/7018-01206/brochures/5952-0292.pdf - 📘 NI – Frequency Counters vs. Spectrum Analyzers
Comparison of real-time analysis vs. discrete signal counting.
https://www.ni.com/en-us/innovations/frequency-counter-vs-spectrum-analyzer.html
📡 5. Spectrum Analyzer Emissions and Shielding
Description: Background on emissions from analyzers and shielding failures in Faraday enclosures.
- 📘 Tektronix – RF Shielding for Spectrum Analysis
Technical guide on preventing re-radiation and ensuring shielding integrity.
https://www.tek.com/document/application-note/spectrum-management-and-monitoring - 📘 Keysight – Best Practices for RF Measurements in Shielded Enclosures
Discusses shielding pitfalls and instrument interference.
https://www.keysight.com/us/en/assets/7018-06150/application-notes/5990-9897EN.pdf
🧠 6. IQ Data, FFT, and Signal Classification
Description: Technical references on the need for FFT, IQ capture, and demodulation to analyze unknown RF signals.
- 📘 Rohde & Schwarz – Demystifying IQ Data
Guide on why IQ capture is essential for modern RF analysis.
https://www.rohde-schwarz.com/us/solutions/test-and-measurement/knowledge-center/iq-data-acquisition_254628.html - 📘 Anritsu – Signal Classification Techniques
Shows how waterfall + IQ + DSP = full signal intelligence.
https://www.anritsu.com/en-US/test-measurement/technologies/signal-classification
📶 7. Wideband Antenna Design Limits
Description: Clarifies why an antenna cannot reasonably cover 9 kHz to 18 GHz without multiple hardware elements.
- 📘 Aaronia – HyperLOG Antenna Specs
Real-world wideband TSCM antennas and their rated ranges.
https://www.aaronia.com/products/antennas/hyperlog-antenna-series/ - 📘 Microwave Journal – Broadband Antenna Engineering
Technical paper explaining physical limits of wideband designs.
https://www.microwavejournal.com/articles/25788-design-and-implementation-of-broadband-antennas
🧪 8. Scientific Methodology and Blind Testing
Description: Requirements for valid scientific testing, including double-blind structure, control groups, and verification.
- 📘 MIT – The Importance of Double-Blind Design
https://www.stat.mit.edu/research/double-blind-testing-principles/ - 📘 National Institutes of Health (NIH) – Bias in Research
Describes types of bias and how to avoid them in signal-based research.
https://www.ncbi.nlm.nih.gov/pmc/articles/PMC3606920/
“This report was obtained from a publicly accessible source and is reposted here under Fair Use for the purpose of professional critique and education. All copyrights remain with the original authors.”
Thank you for uncovering this torture program. Years of torture and abuse on me by vacuous criminals. V2k and Directed Energy Weapons. Best regards